
Welcome to the Hello World Lesson! Hello World is the first lesson whenever learning a new programming language. It is a right of passage for any new developer. The objective is to display the phrase “Hello World” to one’s screen using your programming language’s code. In this lesson, “Hello World” will be outputted to the Salesforce debug log in your Dev Org using the Developer Console.
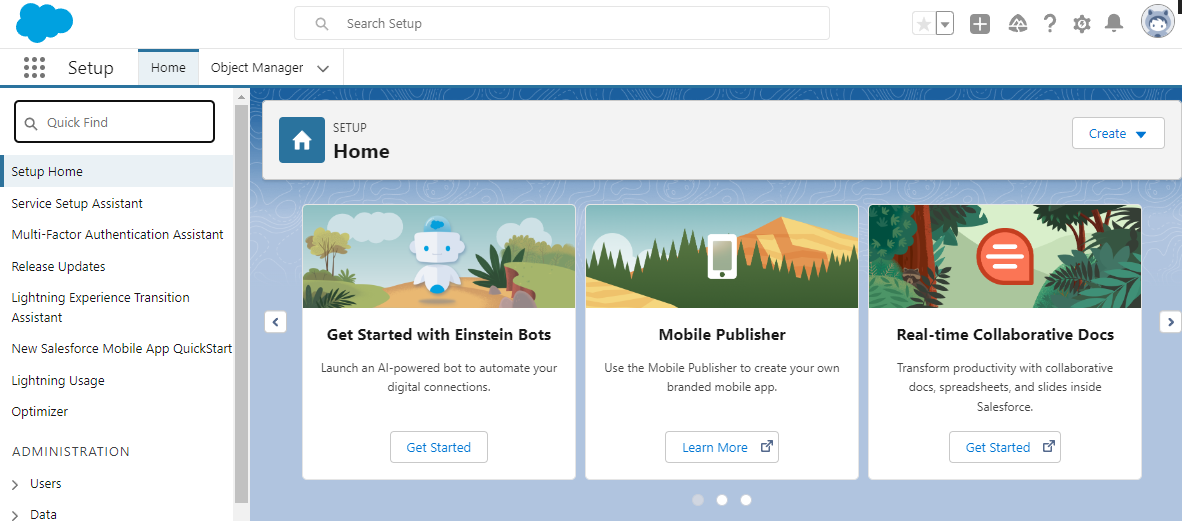
Let’s start by logging into your Dev Org. Open https://login.salesforce.com in your browser, enter your username and password, and then click the Login button. Now, you should see a screen like this:
Open Developer Console
Now that we’re logged into Salesforce, it’s time to open the Developer Console. Click the gear at the top right. This will open a menu like this:
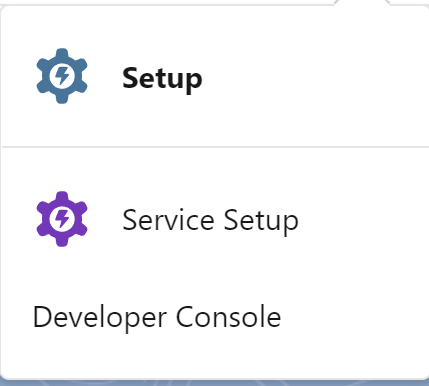
Click the Developer Console item at the bottom. This will open a new browser window that looks like this:
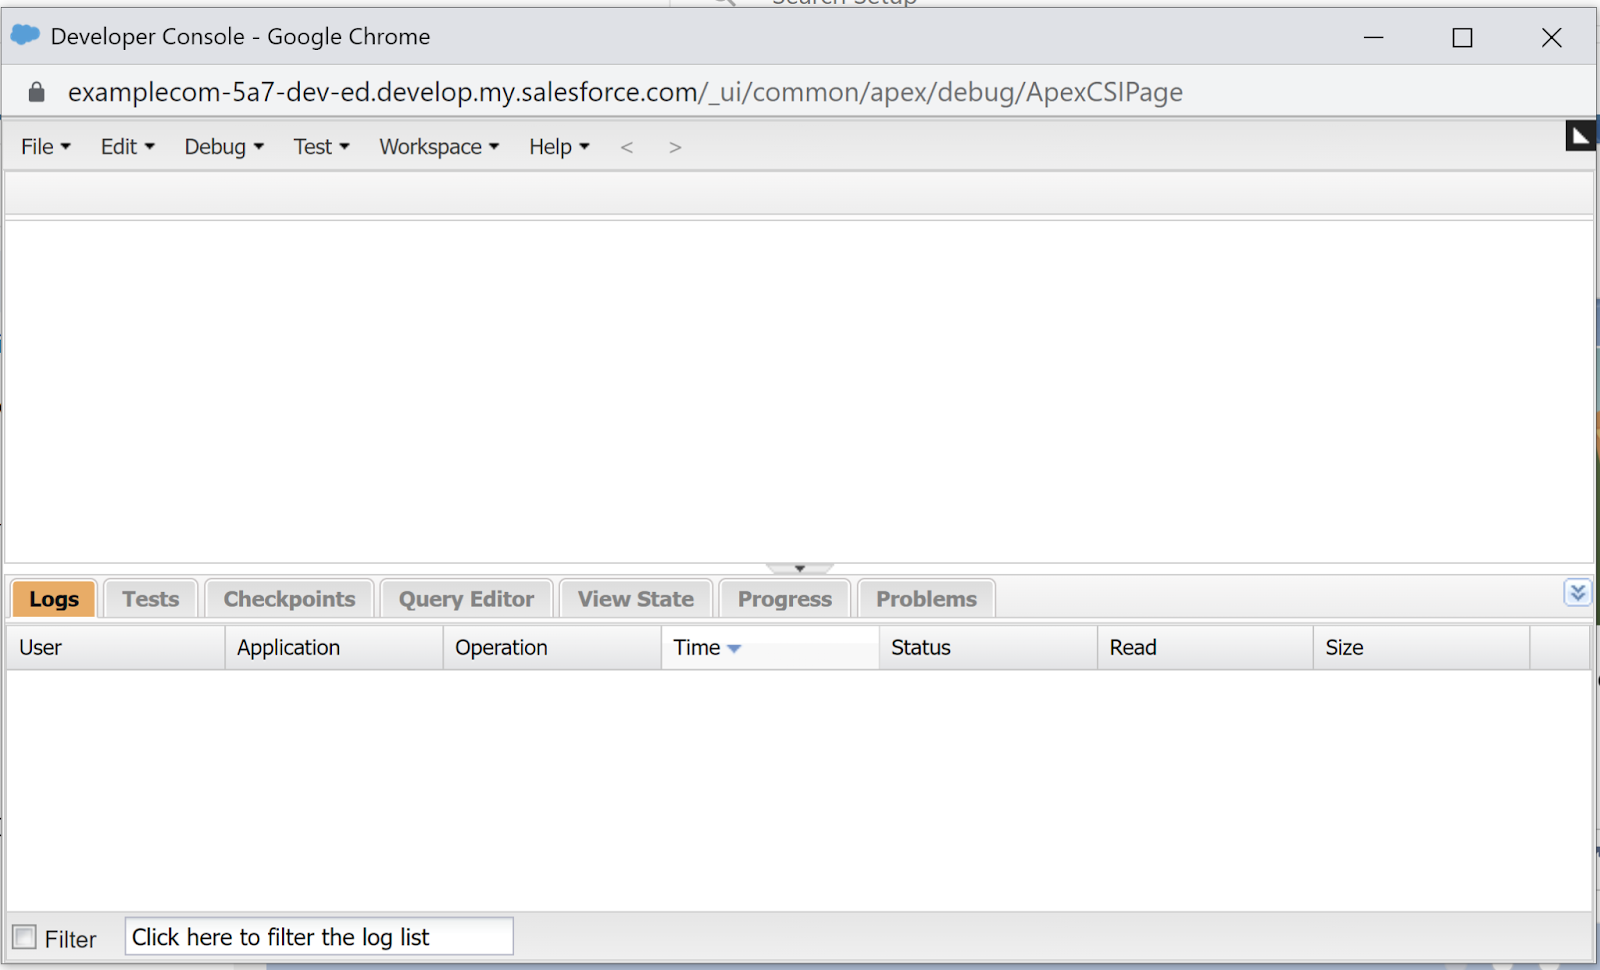
This is Salesforce’s Developer Console. It is a browser tool that lets one perform many developer related tasks like reading, writing, and running Apex code, querying records from the database using SOQL, and viewing what’s happening in Salesforce using debug logs.
Open Execute Anonymous
Click the Debug menu at the top of the Developer Console. This will open the debug menu that looks like this:
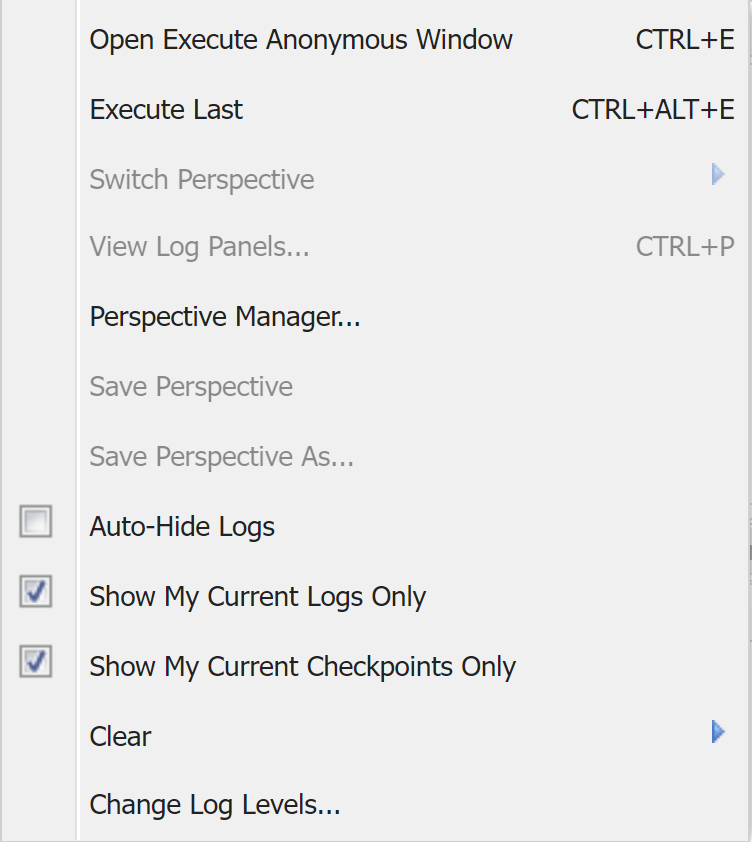
Click the “Open Execute Anonymous Window” menu item. This opens a new modal pane which is a large text box that one uses to enter in one-off Apex code to run on Salesforce. It looks like this:
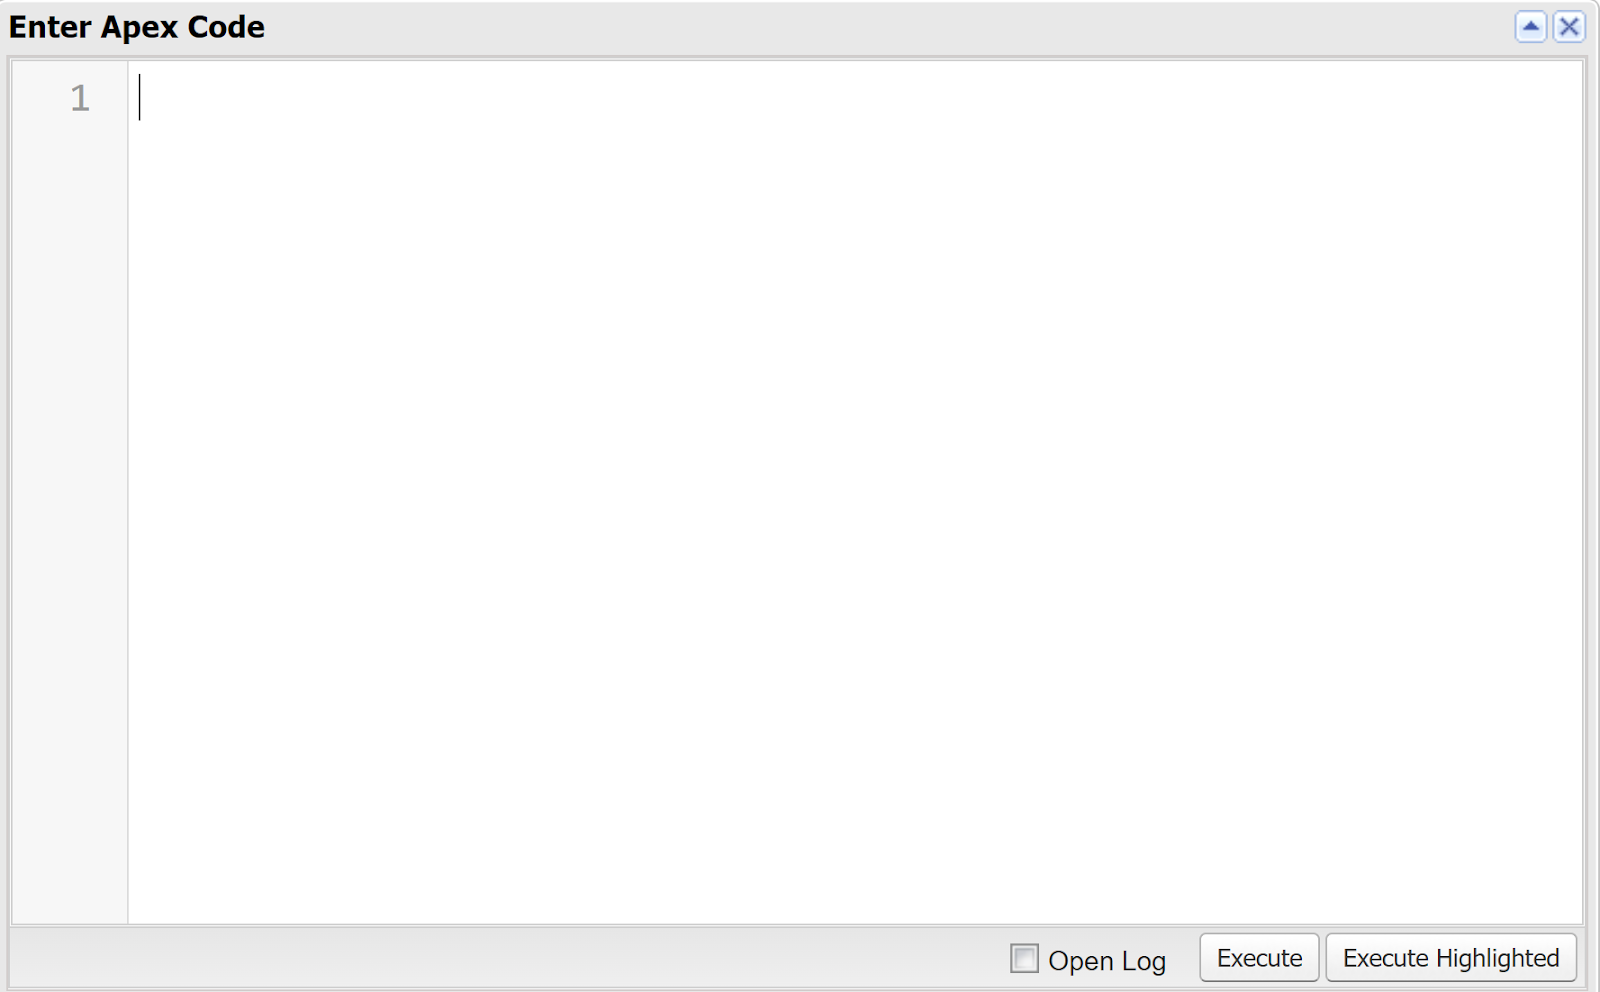
The code that it runs is not saved to Salesforce. It is used to run Apex one time on-demand. One can use Execute Anonymous to run Apex code as many times as needed.
Let’s pause for a moment and explain what code is, explain how it runs, and explain how one can use a debug log to see what is happening in their org.
What is Code?
Code is instructions for a computer to run. Computers are inherently dumb. They have to be told what to do and more importantly how to do it. Code is extremely detailed, text instructions telling a computer what to do and how to do it.
Some instructions can be graphical such as a Salesforce flow! Salesforce says flows aren’t programming but they really are. In fact, by the end of this course, it’ll be easier to learn flows since the logic behind them is very similar to what’s in this course.
How Does Code Run on Salesforce?
To explain how code runs on Salesforce, we have to know a little more about Salesforce’s architecture. Salesforce runs all their software on their computers, also known as servers. They have a multitenant architecture where all their customers share use of these Salesforce servers when running Salesforce’s software. When one enters Apex code in Execute Anonymous and hits Execute, the browser takes that code, sends it over to one of Salesforce’s servers, and the server runs the code using the code’s instructions on that machine. The details of what happens is written to a text file called a debug log.
What is a Debug Log?
Debug Logs are text files that are optionally generated when something happens in Salesforce. They contain information about what happened, when it happened, and the order in which it happened. Every time someone executes some Apex code in Execute Anonymous in the Developer Console, a debug log is automatically created with its outcome.
Write “Hello World” to Debug Log
Now, with that background information covered, let’s write some Apex code to output the words “Hello World” to the debug log and see it on our screen.
In the Execute Anonymous window, type in the following Apex code:
system.debug('Hello World');Note: All Apex code will be shown like this contained within a rectangular border throughout this course. Also, all the Apex code should be typed out and not copied and then pasted. Typing it out will help you remember better. There’s something about typing it that’ll help reinforce your learning.
Now, hit the Execute button. This sends this code to Salesforce’s server to run, generate a debug log, and then that debug log can be viewed to see the outcome of that code running.
Now, click the Logs tab at the bottom, if it’s not already selected. One should see a new row like this:
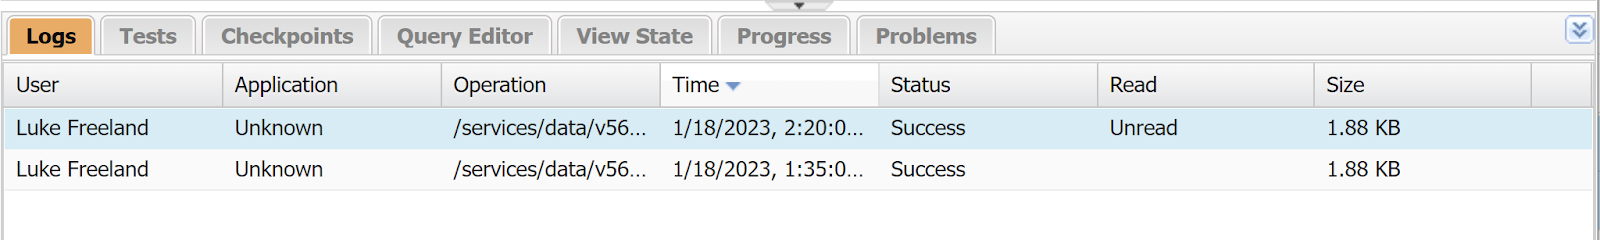
The debug logs are shown from newest to oldest with the newest starting at the top. The status shows the outcome of the code. In this case, the code ran successfully since the status is “Success”. Double click the most recent debug log to open it. It’ll look like this:
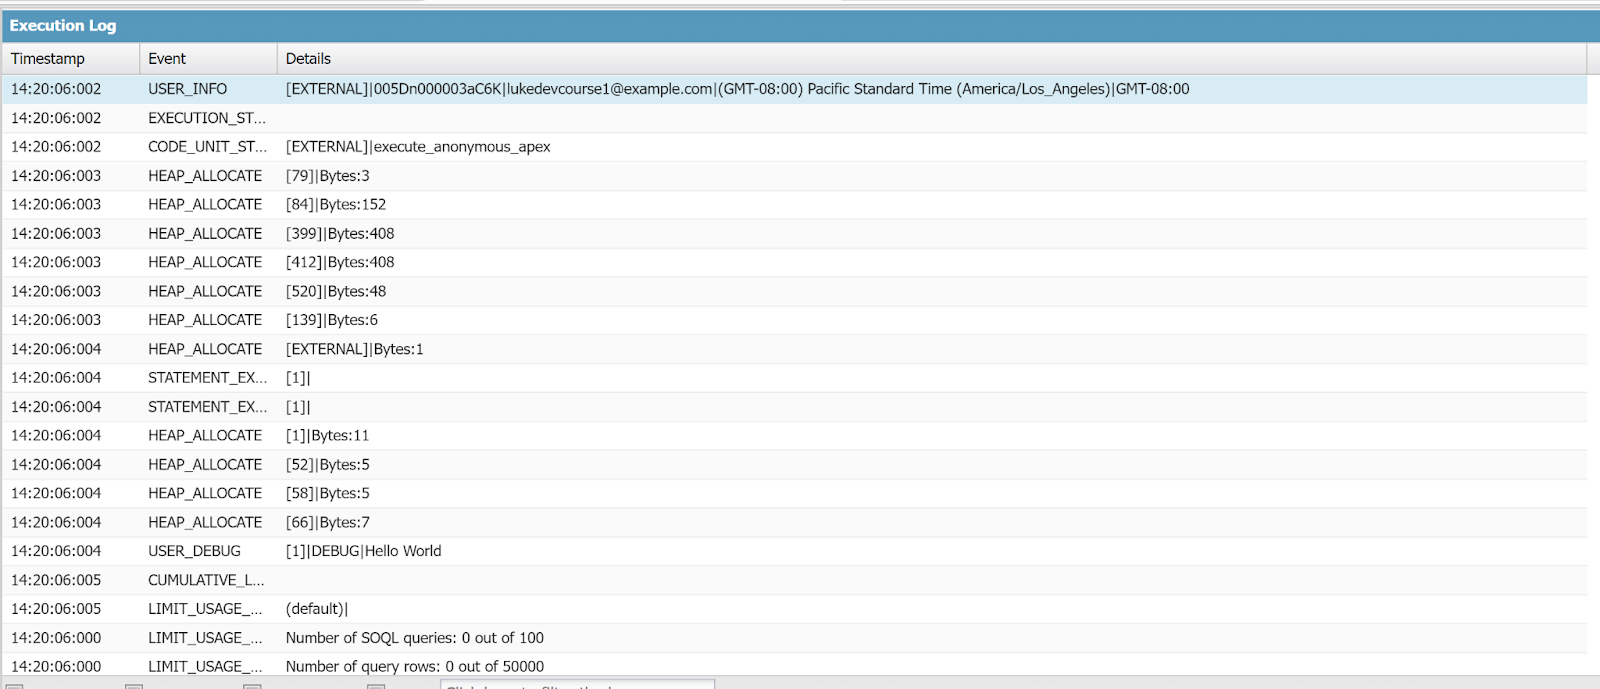
Each row contains a timestamp, event, and details. The timestamp shows when that event happened. The Event describes what happened. The details provide more information about what happened.
At the bottom of the debug log, you’ll see some options for filtering the debug log like this:

Check the Debug Only checkbox to filter the logs to only show the debug message rows from the Apex code. Now the log should only show 1 row like this:
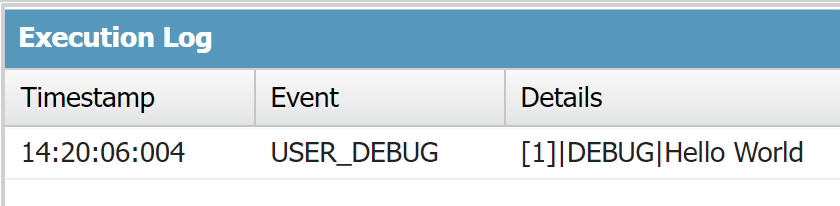
The timestamp shows that this debug log message was logged at 2:20 pm at second 6 and 4 milliseconds. The timestamp uses military time. The event is “USER_DEBUG” which means that the Apex code invoked the system.debug function to write some message to the debug log. The details contain the message that was outputted from the code.
The [] in the details specify the line number in the Apex code that ran to output this message to the debug log. In this case, Line 1 of the Execute Anonymous Apex code did it. The other important piece of information to know is that the message is at the end of the details after the right-most | vertical bar. In this case, the debug message is “Hello World”.
Now, let’s explain the Apex code a bit further. Here it is again for reference:
system.debug('Hello World');system.debug is a static function that Salesforce provides that let’s one provide a string to output to the debug log file. A string is a series of zero or more characters comprising a message. A string has to be enclosed within two single quotes so that the code knows it is a “String”. In this case, the message Hello World is made into a string like this:
'Hello World'The message is placed inside a left and right parentheses and the code line is ended with a semicolon. One can use system.debug as many times as needed to output all the needed information to the debug log to determine what is happening in their Apex code and Salesforce overall. Every time system.debug is used, the message is output onto its own line.
Debug logs are the primary way to see what is happening in Salesforce.
Strings and functions will be covered in more detail later in this course.
Congratulations, you just wrote your first line of Apex code and executed it! This is a milestone to remember.